
Blog / Engineering guide
Normalizing RO membrane trends for troubleshooting
Use consistent feed, pressure, flow and conductivity data to distinguish operating changes, fouling, leakage and membrane damage in an RO train.
HOSON WATER editorial · 8 min read
Published · Updated
Compare performance under equivalent conditions
Normalize RO operating data before using a production decline to justify cleaning or replacement. Feed temperature, salinity, pressure, recovery and permeate backpressure can change raw output even when membrane condition is similar. Normalization applies the membrane manufacturer's method to a chosen reference condition. It gives the operator a more consistent trend for investigating a change.
Start by validating the measurements and confirming what changed in plant operation. A normalization calculation cannot correct a mis-scaled flow signal or a conductivity probe reading air. Use the installed element documentation to select the method and limits. Retain raw data alongside normalized results so a process engineer can reproduce the calculation. Read normalized permeate flow, salt passage and differential pressure together, then investigate the timing and location of the change.
Make a reliable operating baseline
Choose a stable operating period after commissioning and the approved startup sequence. Record the installed membrane model, element positions, array arrangement, vessel count and operating trains. Capture feed and permeate pressures, stage inlet and outlet pressures where available, permeate and concentrate flow, conductivity, temperature and relevant dosing conditions. Give every measurement a tag, unit and physical location.
Check whether flows include internal recycle or streams shared with another train. Record the conditions under which a sample was taken and the analyzer temperature-compensation settings. Save the baseline as a controlled record with a date. When the array, instruments or setpoints deliberately change, create an identified new comparison basis. Keeping the earlier record helps explain changes across maintenance periods without quietly combining two different plant configurations.
Check instruments before diagnosing the membranes
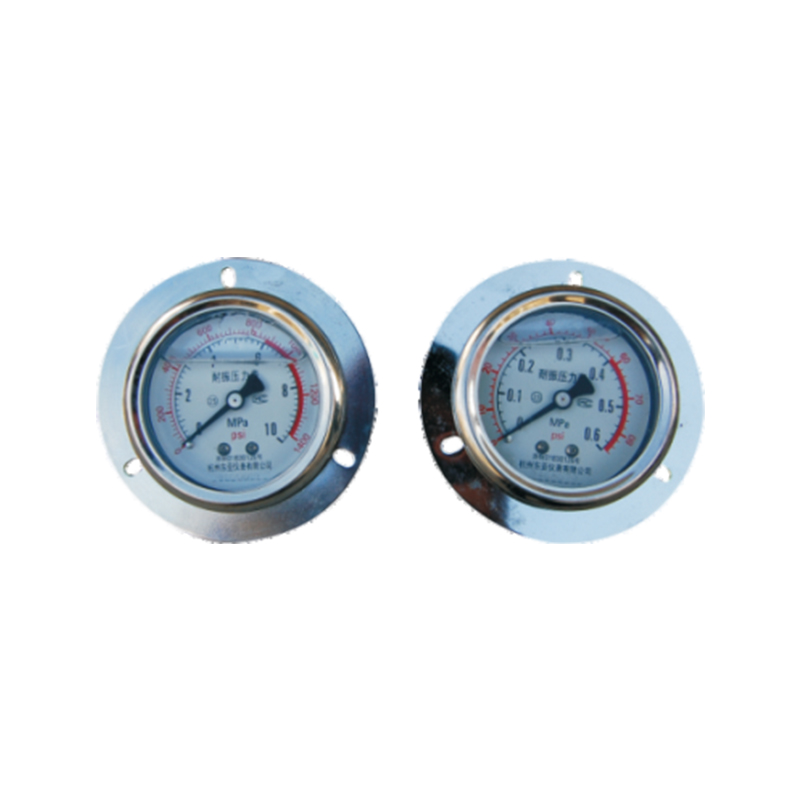
Compare local indications with control-system values and confirm scaling, units and timestamps. Look for a sensor that changed after replacement, a flow totalizer reporting different units or a temperature signal held at a default value. Verify that pressure taps and sample lines remain open and representative. A blocked small-bore connection can leave a believable but stale indication.
Use an independent check where practical and appropriate to the site procedure. Confirm that feed, permeate and concentrate flow approximately close the defined balance during stable operation. Review conductivity measurements under compatible temperature conditions. If readings disagree, investigate the measurement chain before adjusting the process. Record the as-found discrepancy and its correction. Otherwise, a repaired instrument may appear in the historian as sudden membrane recovery or damage.
Separate pressure loss from driving pressure
Stage differential pressure is the difference between the relevant stage inlet and concentrate outlet pressures. Its interpretation depends on feed flow, configuration and measurement locations. Net driving pressure considers hydraulic and osmotic conditions driving water through the membrane, including permeate-side pressure. These are different diagnostic quantities, so label them explicitly in the trend.
A pressure value at the high-pressure pump discharge may include pipe or cartridge-filter losses before the vessel. Similarly, a downstream valve change can increase permeate backpressure without changing the pump display in an obvious way. Trace the pressure boundaries on the drawing. If the engineer calculates a diagnostic value from several instruments, preserve the component readings. This makes a surprising result traceable to either the process or one contributing measurement.
Understand the normalization calculation
Use the method specified for the installed membrane and the variables required by that method. DuPont's FilmTec technical guidance explains the effect of changing operating conditions and describes normalized monitoring. Apply the corresponding manufacturer procedure when another element is installed. Record the reference condition, calculation version and any input assumptions so later reports remain comparable.
Normalization supports comparison but does not identify a contaminant, prove mechanical integrity or establish product suitability by itself. A stable normalized trend can coexist with a problematic absolute product-water value if the reference basis is unsuitable for the end use. Keep operating-limit checks and product-release criteria visible alongside the trend. Review unusually large changes in feed chemistry with the designer rather than assuming a correction factor captures every change in treatment duty.
Read several trends as one event
A gradual reduction in normalized flow with rising stage differential pressure suggests a different investigation from an abrupt increase in salt passage after maintenance. Start with the sequence of events. Identify which signal moved first, whether every train changed and whether the shift began during startup, a dosing change, cleaning or instrument service. Compare similar trains only after accounting for duty and configuration.
Treat the pattern as evidence for the next check. Increased salt passage can involve operating conditions, leakage, element performance or chemical damage. A higher differential pressure can involve deposits, flow changes or a measurement problem. Record the competing explanations and the observation that would help distinguish them. Avoid assigning a cause solely because one metric resembles a familiar failure pattern.
Locate a change before choosing an intervention
Examine train-level and stage-level data separately where instrumentation allows it. Compare vessel permeate quality using the approved sampling arrangement. A shared header can dilute a localized quality problem and make a single high reading difficult to locate. Use an engineer-approved isolation or sampling plan that respects pressure and chemical hazards and preserves required plant protection.
Review recent element loading, interconnector work, valve maintenance and instrument changes. A quality shift that follows an intervention deserves a direct review of that work. Check assembly records and appropriate leak-testing procedures before assuming all elements need replacement. If laboratory or specialist examination is justified, identify the sample, its position and preservation requirements. Maintain records linking that evidence to the operating event.
Use pretreatment records to explain the membrane inlet
Put membrane trends beside inlet water-quality and pretreatment history. Include filter differential pressure, UF operating events where present, chemical dosing, source-water changes and any oxidant excursions. Record when the plant was idle and how it was preserved. The water reaching the membrane during an upset may differ substantially from a routine laboratory sample collected days earlier.
Ask whether the anomaly affects all trains supplied by the same source or only one train. Review tank levels, feed-pump availability and backwash sequences for temporary hydraulic changes. Align clocks between the pretreatment controller, RO system and laboratory logs. An apparent coincidence can disappear when a time offset is corrected. These checks help identify a recurring upstream condition that cleaning the membrane alone would leave unresolved.
Check a simple balance before interpreting software output
Suppose a train reports ten cubic meters per hour of feed, eight of permeate and three of concentrate. For a steady single-pass boundary without other streams, those readings do not close. Check whether the signals were collected at the same time, whether recycle crosses the boundary and whether instrument scaling changed. Correct the input record before using it to explain membrane condition.
Keep the accepted tolerance tied to meter capability and operating stability. A balance test does not identify which instrument is wrong, but it reveals when an apparently precise calculation rests on conflicting data. Save the correction history alongside the normalized result. This is particularly helpful when production is compared across shifts that use different manual-reading times or average periods.
Preserve startup and shutdown information
Separate stable-production trends from transitions without discarding the transition record. Startup may involve flushing, product diversion, pressure ramping and changes in recovery. A daily average that combines these states can obscure the stable duty and make two otherwise similar days appear different.
Record the operating state with each trend and identify the period used for normalization. If a sudden anomaly began after a shutdown, examine preservation, drain-back, valve positions and the approved restart procedure. Keep any offline instrument work visible on the same timeline. These details help the engineer decide whether a change reflects the current steady condition, a recent event or an incomplete measurement record.
Make the cleaning decision specific to the element
Follow the installed manufacturer's criteria and an approved procedure when deciding whether to clean. Review normalized trends, cleaning history and the likely deposit with the supplier. A generic percentage from another membrane family may use a different baseline or condition. Record why cleaning is proposed and which post-cleaning results will be used to judge the outcome.
Confirm chemical identity, concentration, pH, temperature, circulation arrangement and compatibility for the actual element, seals and cleaning equipment. Use the site's isolation, chemical handling and waste procedures. The operator should have an approved written sequence and the necessary instruments. When an unfamiliar foulant is suspected, obtain technical review before improvising chemistry. Preserve the pre-cleaning data so the result can be compared against a documented starting point.
Evaluate recovery after the system stabilizes
After the approved rinse and return-to-service sequence, collect data under stable conditions and apply the same normalization method. Compare normalized flow, salt passage and differential pressure with the recent pre-cleaning period and the relevant baseline. Record any changed valves, sensors or operating setpoints so their effects remain visible. Confirm product quality separately before releasing water to its intended use.
If flow improves but quality worsens, keep both observations in the report. If pressure loss remains high, consider what parts of the hydraulic path were included in the cleaning. A partial recovery may justify additional investigation, a different maintenance plan or a revised operating duty. Let the evidence determine the next action. Repeated cleaning without reviewing the cause can consume chemicals and downtime while the initiating problem continues.
Prepare a troubleshooting package that can be reproduced
Send the technical team raw and normalized trends from before, during and after the event. Include the calculation method, baseline, element arrangement, feed analysis and recent maintenance log. Provide a short chronological description of the first symptom, operator response and subsequent changes. Label all units and time zones. A screenshot without tag definitions or operating context often creates avoidable follow-up questions.
Set an owner and a verification condition for each proposed action. Instrument checks, revised sampling, inspection and cleaning should each produce a record that can confirm or reject a specific explanation. Use the HOSON membrane-family pages to identify the equipment under discussion, then request model-specific guidance. Close the investigation with the accepted cause, corrective action and updated monitoring plan so the same uncertainty is easier to resolve next time.